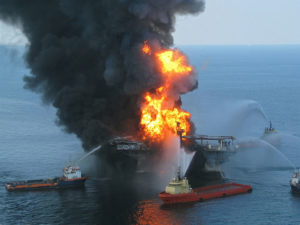
Diving Deep Into An Oil Spill
Editor’s note: In an award-winning NPR story, Richard Harris uncovered the true damage behind the largest oil spill in U.S. waters. But perhaps more impressive is the story behind the story.
I first got a behind-the-scenes look at the reporting that went into this five-minute radio blurb when Harris visited my graduate class at NYU’s Science, Health and Environmental Reporting Program in 2015. Learning about the rapid-fire investigative work that made the story possible helped me, an aspiring science journalist, see what science journalism was really about. Something finally clicked for me. But before I give too much away, here’s the story behind the story in Harris’s own words:

An investigative story that has a big impact doesn’t always have to involve months of work and bushel-barrels of information in cross-linked databases. One of the biggest stories of my career took only a day of rapid-fire work.
Here’s how I came to discover and report that the U.S. government was vastly underestimating how much oil BP’s Deepwater Horizon well was spewing into the Gulf of Mexico back in 2010.
I had been nipping away at the edges of the story (not covering the daily tick-tock), and in so doing had been keeping in close touch with a smattering of scientists who had been drawn into the story for various reasons. One of those people, Ian MacDonald at Florida State University, had studied natural oil seeps in the Gulf for many years. Consequently he knew a lot about spills, as well.
MacDonald was concerned when the Coast Guard started using its usual technique to measure this extraordinary spill. Basically they looked at oil floating on the water’s surface and estimated its volume by measuring the extent of the sheen. That’s a reasonable method for measuring a spill that is, say, coming from a leaking barge. But this spill was bubbling up through nearly a mile of water. So MacDonald thought the surface spill-measuring method was simply too, well, superficial.
But with no way for MacDonald and other experts to tackle the problem, the government (and news organizations) only reported BP’s estimate of 5,000 barrels per day — an estimate so modest that the spill didn’t come close to the top spills in history.
Then, nearly a month after the spill began, I was chatting on the phone with MacDonald when he noted that the Coast Guard was using a new video as the backdrop of its news conference. It was a loop of video taken by a remotely piloted vehicle at the sea floor, showing oil gushing out of the end of the broken pipe.
MacDonald said words to this effect: I don’t know how to measure the volume of a fluid by studying a video of it, but I know there are people out there who can do it. Find them!
The Coast Guard released the video clip, and I went to town. I first called the fluid dynamics lab at Brown University. The professor I talked to there said he was tied up with finals and couldn’t stop to help, but suggested I cast about to find someone who uses a technology called PIV, or particle image velocimetry. This estimates the volume of a liquid by examining video of its flow pattern.
AAAS KAVLI SCIENCE JOURNALISM AWARD |
| The AAAS Kavli awards recognize distinguished science reporting by professional journalists. Harris’s story won the radio award in 2010. |
That lead led me to Steve Wereley at Purdue University, who’d written a technical book on the technique. Wereley was eager to analyze the video for me.
I wanted more than one source, of course. So I called Tim Crone at the Lamont-Doherty Earth Observatory. He studies natural deep-sea vents, so I wondered if he had a technique to measure the outflow of fluids from them. He did. And he, too, accepted the challenge to assess the flow rate visually.
I also called my friend Bob Sanders in the University of California, Berkeley press office to see if anyone on his campus had been noodling around with the video. Bob said he’d heard that astrophysicist Eugene Chiang had taken an interest. So I called him, as well.
Luckily, Chiang already had an answer for me. As an exercise in curiosity, he had simply applied first principles of physics, mainly watching the curvature of the plume as it shot from the horizontal pipe on the sea floor and turned vertical. On that basis, he’d figured, with a large margin of error, that the flow was 50,000 to 100,000 barrels of oil a day.
That was more than 10 times what the government had been estimating based on its standard approach. It also meant that the spill was already far larger than the 1989 Exxon Valdez accident, which poured at least 250,000 barrels of oil into the Prince William Sound in Alaska and was previously the largest spill in U.S. waters.
Tim Crone at Lamont-Doherty also worked through the numbers quickly. His estimate was that the flow was about 75,000 barrels a day, plus or minus a margin of error that he couldn’t quite finger. His estimate was clearly within the same range as Chiang’s.
Steve Wereley had no such hesitation. His analysis put the flow rate at 72,000 barrels a day, plus or minus just a few percent.
So I had three different methods, providing three consistent answers. All within 24 hours, I had quite the story.
| Richard Harris is a science correspondent at National Public Radio. He is also a CASW board member. |

