Laser maps reveal slide risk with startling clarity, but few citizens know they exist
Sandi Doughton’ story about the benefits of an aerial scanning technique to reveal a wide range of geologic perils encouraged Washington State Legislature to pass legislation that will expand the use of that very technique. It also won an award given by the American Geophysical Union in 2015. Doughton is a science writer for The Seattle Times and the author of Full Rip 9.0: The Next Big Earthquake in the Pacific Northwest.
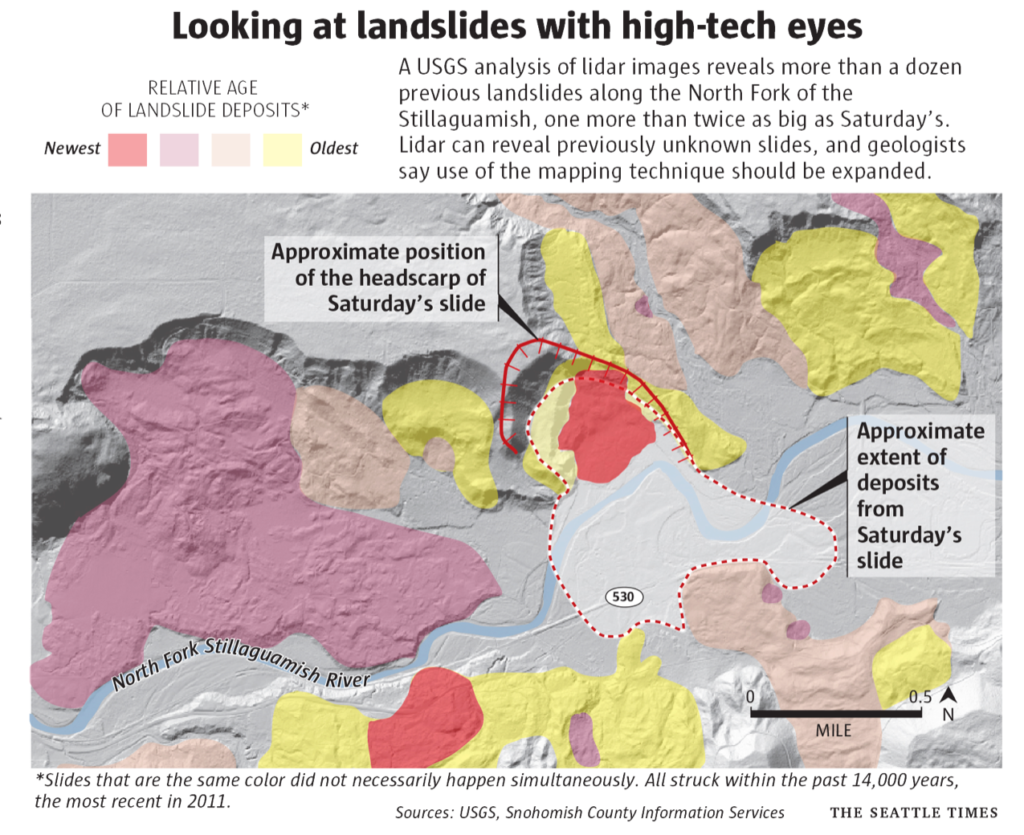
People who lived near the Snohomish County hillside that collapsed last week could see with their own eyes that it had slid before.
But it takes a more high-tech type of vision to fully grasp the danger along that stretch of the Stillaguamish River.
Maps created by an aerial scanning technique called lidar (lie-dar) reveal with stunning clarity a series of giant scars and piles of debris left by past landslides up and down the valley, including one more than twice as big as the monster that ripped loose Saturday.
AMERICAN GEOPHYSICAL UNION’S DAVID PERLMAN AWARD |
| The AGU’s David Perlman award recognizes science news writing that makes the Earth and space sciences accessible and interesting to the public. This story was honored in 2015. |
Lidar’s ability to peer beneath the region’s thick vegetation and lay bare the landscape has made it the go-to source on a wide range of geologic perils, from earthquake faults to flood zones.
But outside the circle of geologists, engineers and land-use experts, few people know the maps exist or how to access them. And though lidar can spot landslides that other surveys miss, counties are inconsistent in the way they incorporate the new information into their hazard planning.
“We’ve got all this great new data,” said University of Washington geologist David Montgomery. “But if you don’t have anybody to digest it and turn it into information that can get out to the public — it’s just nice data.”
Lidar mapping in Seattle in the early 2000s identified four times the number of landslide zones spotted with aerial surveys.
Several of the slides along the Stillaguamish that pop out in lidar images aren’t included in the Washington Department of Natural Resources’ (DNR) statewide landslide inventory, said Ralph Haugerud, a lidar expert with the U.S. Geological Survey. And while even some experts were shocked that Saturday’s slide plowed across the river, the lidar images show that some of the old slides in the vicinity were clearly powerful enough to have run out even further.
“Lidar is like a new pair of glasses,” Montgomery said. “If you can see more, if you have better data, you can better assess the true risks.”
The technique has only been widely used in the Northwest for little more than a decade, said Craig Weaver, chief of the Seattle branch of the U.S. Geological Survey (USGS). He estimates nearly a quarter of the state has been mapped, including most of the Puget Sound basin.
To create a map, an airplane equipped with special lasers flies back and forth in a grid, firing up to 150,000 light pulses per second at the Earth. The system calculates how long it takes the pulses to bounce back to the plane, and assembles a topographic profile.
Only about one in seven pulses actually hit the ground, Haugerud explained. The rest bounce off trees, bushes and buildings. A computer program discards those errant signals, essentially erasing the vegetation and generating an image of the bare landscape.
Topographic maps generated by lidar are accurate to within a few inches.
That’s far better than traditional contour mapping based on aerial photography. “In heavily forested landscapes you have no idea what the ground surface looks like in detail,” Haugerud said. “So all of our topographic maps are kind of fuzzy.”
In contrast, lidar images are so crisp features seem to pop off the page.
The first lidar survey in Washington was conducted on Bainbridge Island for land-use planning. But when USGS scientists got a look at the map, they realized that an odd line cutting across the island was actually a previously hidden earthquake fault.
Since then, the USGS has used the method to identify more than a dozen major faults in the Puget Sound region.
But extending the method to analysis of landslide risk has progressed more slowly.
DNR’s inventory was compiled without lidar data, Haugerud said. Most counties rely on lidar to some extent when they review building-permit applications, but few have the resources to analyze the data in detail.
“I hope a lot of counties take a good, hard look at their landscape hazard zones after this,” said Dan McShane, an engineering geologist in Bellingham, who blogs at Reading the Washington Landscape.
Seattle was one of the first cities to use lidar for landslide mapping. Initially, there was concern that releasing the information to the public would harm property values and slow development, said former state emergency management director Jim Mullen, who headed Seattle’s emergency operations at the time.
“We put it out anyway,” Mullen said. “The public needs to know these kinds of things … and developers who are really smart want to know what the risks and hazards are so they can engineer around them.”
King County uses lidar to identify flood-prone areas and slopes where landslides are likely. Some counties, including King and Jefferson, have online tools that allow anyone to zoom in lidar maps down to the parcel level, though the quality and resolution of the images varies.
Snohomish County also has a collection of lidar maps accessible online, including maps of the slide area from 2013.
But across much of the state, it’s hard for an average person to find lidar maps or navigate the complex portals where the data is stored.
A group called the Puget Sound Lidar Consortium serves as a kind of clearinghouse for lidar maps and data. But the group operates on a shoestring budget and its website is designed for experts, not lay people.
“Lidar is a powerful tool, and it really needs to be disseminated better,” McShane said. Ideally, anyone seeking a building permit or buying a house should be able to examine lidar images of the property for any hidden geologic hazards, he added.
Haugerud and other geologists would like to see a systematic, statewide lidar survey for landslides, followed by on-the-ground geologic studies to help determine how frequently slopes have slid in the past, and how likely they are to slide in the future.
Some of the ominous-looking landslides detected by lidar may be more than 12,000 years old and not much of a threat anymore, he explained. But other slides that predate historic records may still be active and dangerous.
“We would like to be able to look at any parcel and answer the question: What are the odds of being hit by a landslide in the next century?” Haugerud said.
But better landslide inventories and risk assessments won’t make any difference unless policymakers act on them, Mullen said.
The landslide risks near Oso were well documented, even before the advent of lidar, yet construction was still allowed in harm’s way.
“We need to look at all the tools we have that tell us what are risks are,” Mullen said. “Then we need to have some community discussion … about whether we are prepared to address them.”
You may view the story in its original format at The Seattle Times.